Advanced plotting#
def func(x, y):
"""
A nice looking mapping.
"""
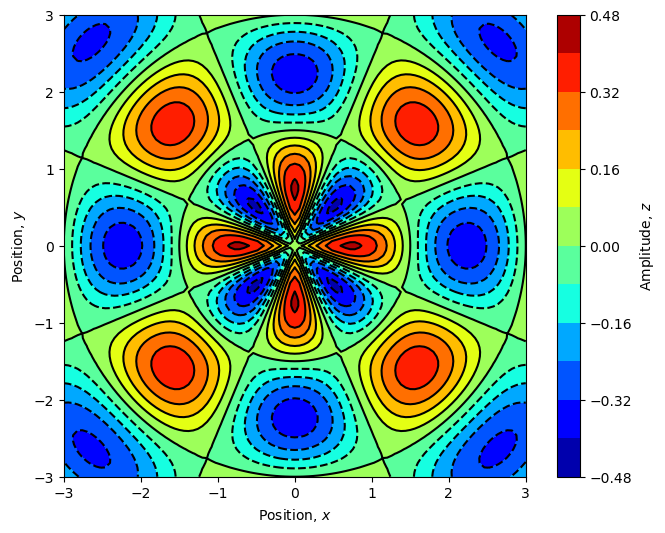
r = (x ** 2 + y ** 2) ** 0.5
theta = np.where(r != 0.0, np.arccos(x / r) * np.sign(y), 0.0)
z = (1.0 / (r + 5.0) ** 0.5) * np.sin(2.0 * np.pi * r / 3.0) * np.cos(4 * theta)
return z
x = np.linspace(-3.0, 3.0, 101)
y = np.linspace(-3.0, 3.0, 101)
X, Y = np.meshgrid(x, y)
X
array([[-3.  , -2.94, -2.88, ...,  2.88,  2.94,  3.  ],
       [-3.  , -2.94, -2.88, ...,  2.88,  2.94,  3.  ],
       [-3.  , -2.94, -2.88, ...,  2.88,  2.94,  3.  ],
       ...,
       [-3.  , -2.94, -2.88, ...,  2.88,  2.94,  3.  ],
       [-3.  , -2.94, -2.88, ...,  2.88,  2.94,  3.  ],
       [-3.  , -2.94, -2.88, ...,  2.88,  2.94,  3.  ]], shape=(101, 101))
Y
array([[-3.  , -3.  , -3.  , ..., -3.  , -3.  , -3.  ],
       [-2.94, -2.94, -2.94, ..., -2.94, -2.94, -2.94],
       [-2.88, -2.88, -2.88, ..., -2.88, -2.88, -2.88],
       ...,
       [ 2.88,  2.88,  2.88, ...,  2.88,  2.88,  2.88],
       [ 2.94,  2.94,  2.94, ...,  2.94,  2.94,  2.94],
       [ 3.  ,  3.  ,  3.  , ...,  3.  ,  3.  ,  3.  ]], shape=(101, 101))
Z = func(X, Y)
/tmp/ipykernel_2920/389966453.py:6: RuntimeWarning: invalid value encountered in divide
  theta = np.where(r != 0.0, np.arccos(x / r) * np.sign(y), 0.0)
fig = plt.figure(figsize=(8, 6))
ax = fig.add_subplot(1, 1, 1)
ax.set_aspect("equal")
cont = plt.contourf(X, Y, Z, 10, cmap=cm.jet)
cbar = plt.colorbar(cont)
cbar.set_label("Amplitude, $z$")
plt.xlabel("Position, $x$")
plt.ylabel("Position, $y$")
plt.contour(X, Y, Z, 10, colors="black")
plt.show()